To take raw data files in a csv file and transition it to a table format:
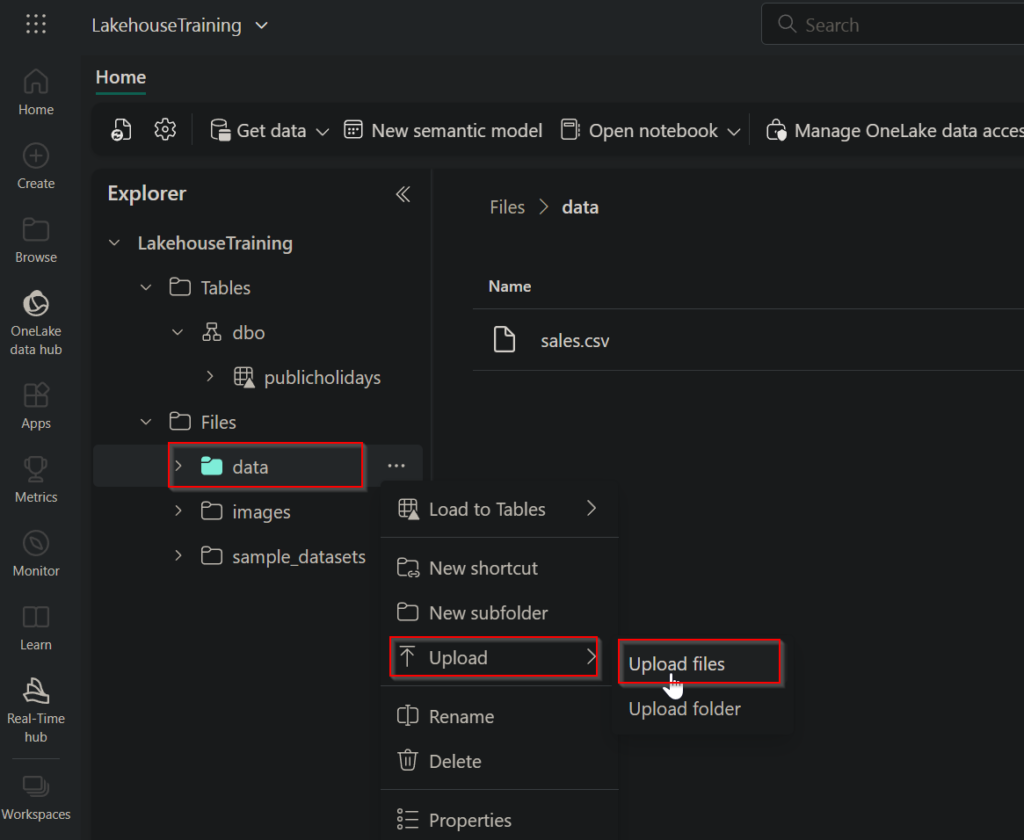
In OneLake, access Files > data > ellipses > upload > upload files. Here, you will be able to upload a csv file or an excel file.
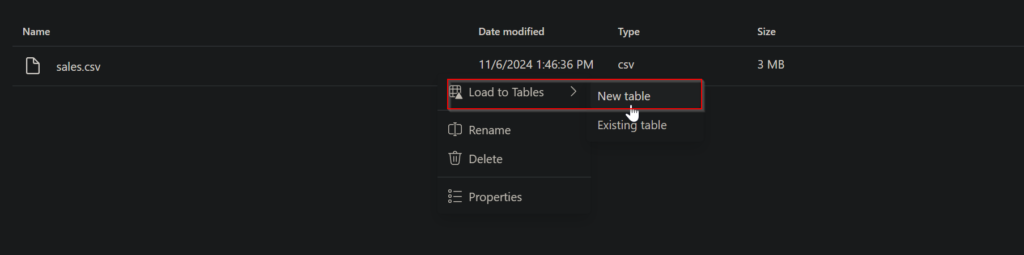
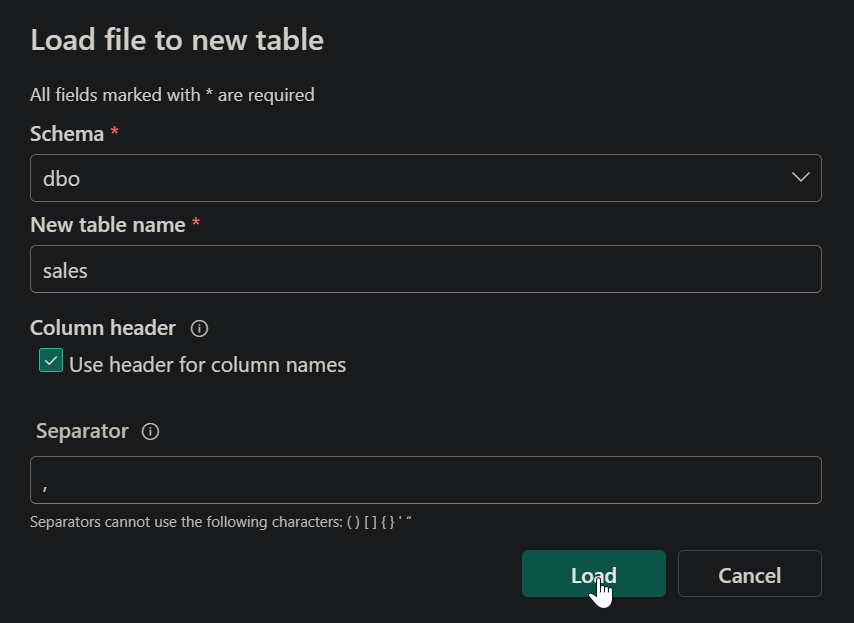
From the data file, select the ellipses > Load to Tables > New table or Existing table. In my case, I am creating a new table and have configured the separator to be comma driven.
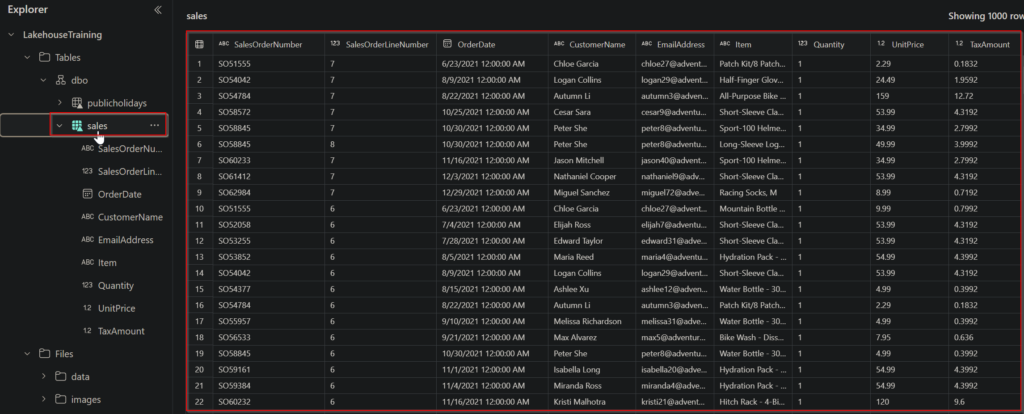
Once it’s done loading, you should be able to see a new table under the appropriate schema.
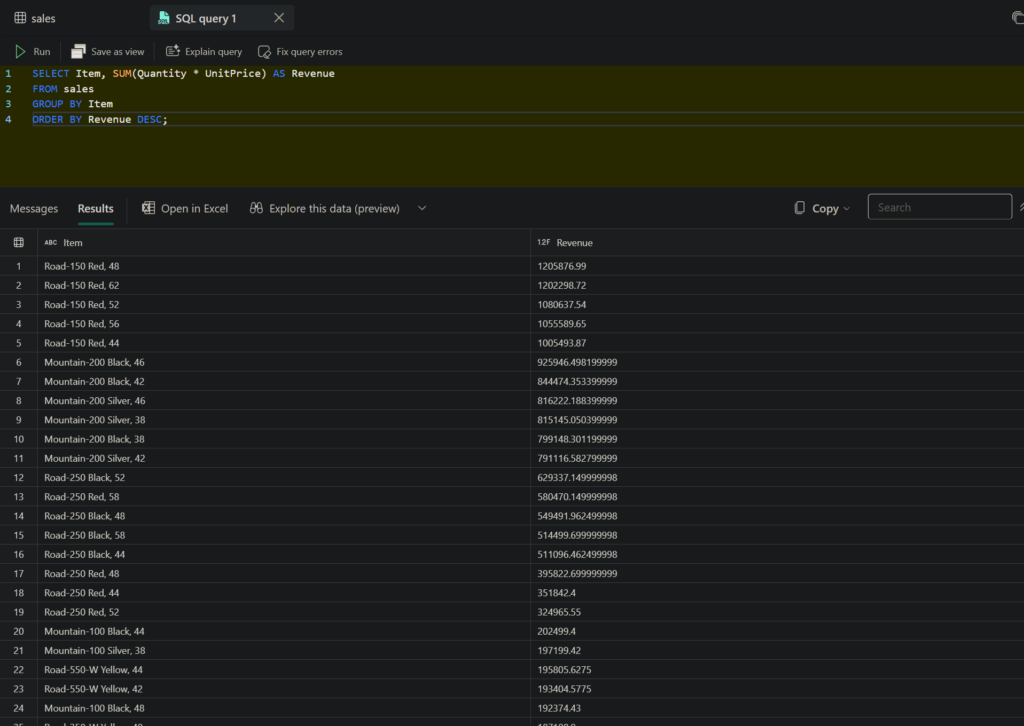
Access the SQL analytics endpoint to allow for db table querying. For example, we can run this simple query to see our output.
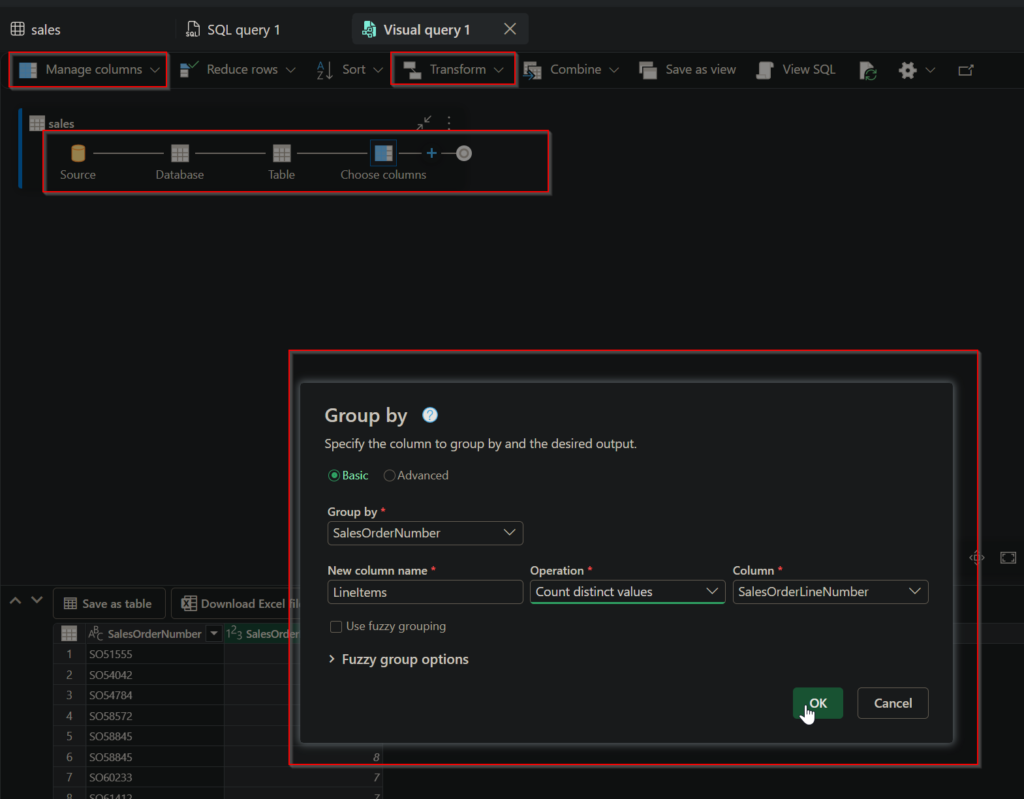
For a low code alternative, we can use the visual query feature to manage columns and transform them as well.
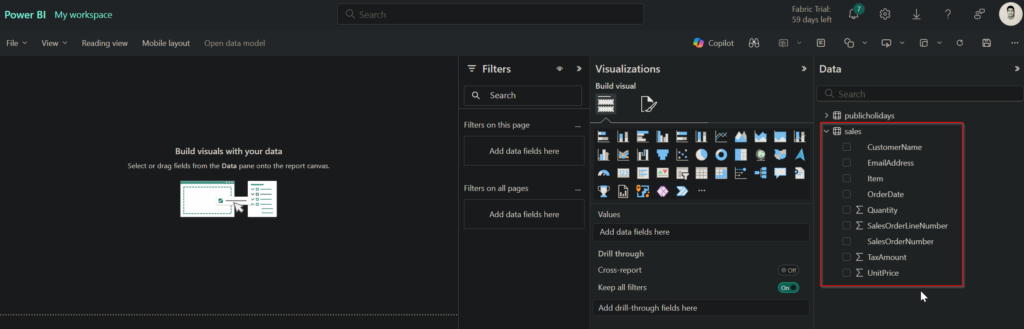
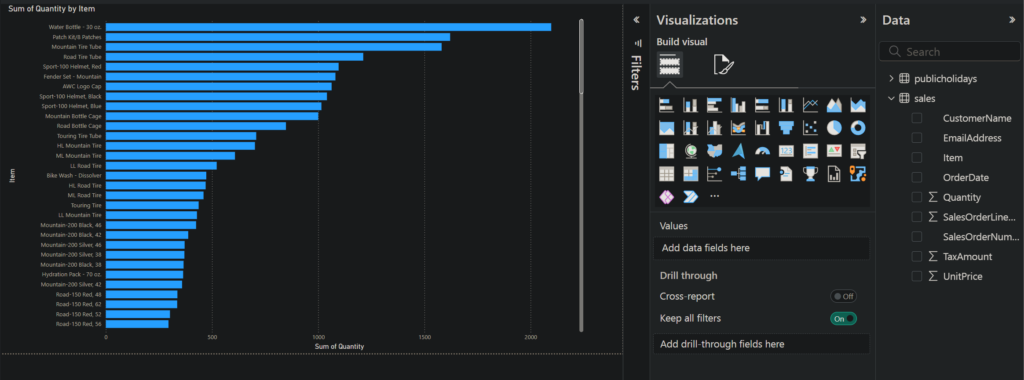
Select Model Layouts in the side menu and select a specific table and under the Reporting tab, select New Report. A PowerBI environment will show up with the data connected.