
In Jira, we will leverage the Dashboard feature to fulfill this requirement.
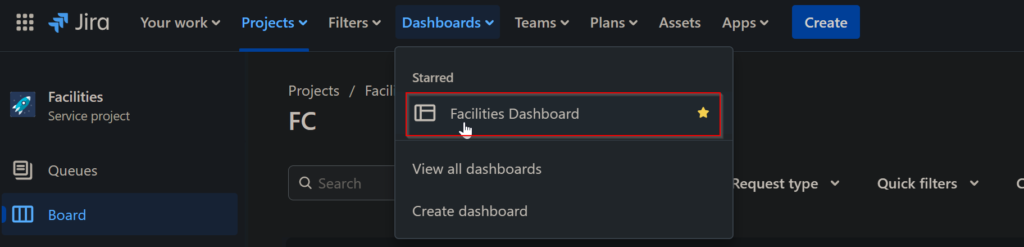
Select Dashboards and pick the dashboard in question.
Click Edit to edit the existing dashboard.
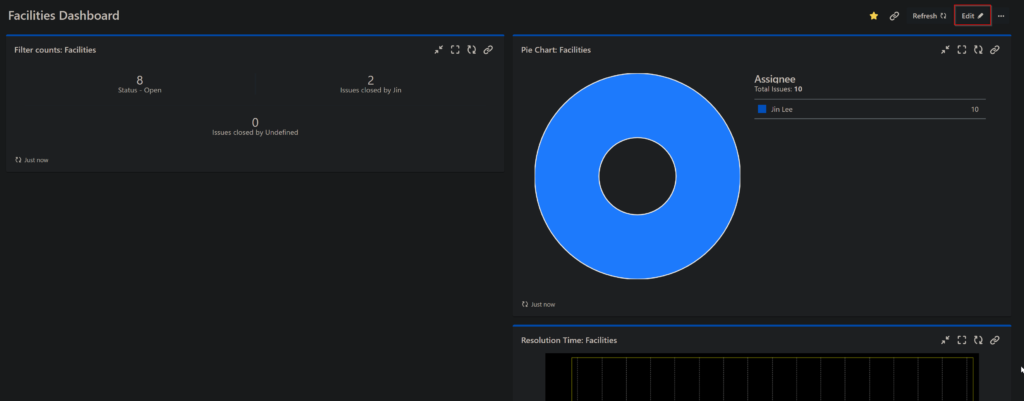
You will be given the options to add Gadgets to the dashboard for specific metrics you would like to see.
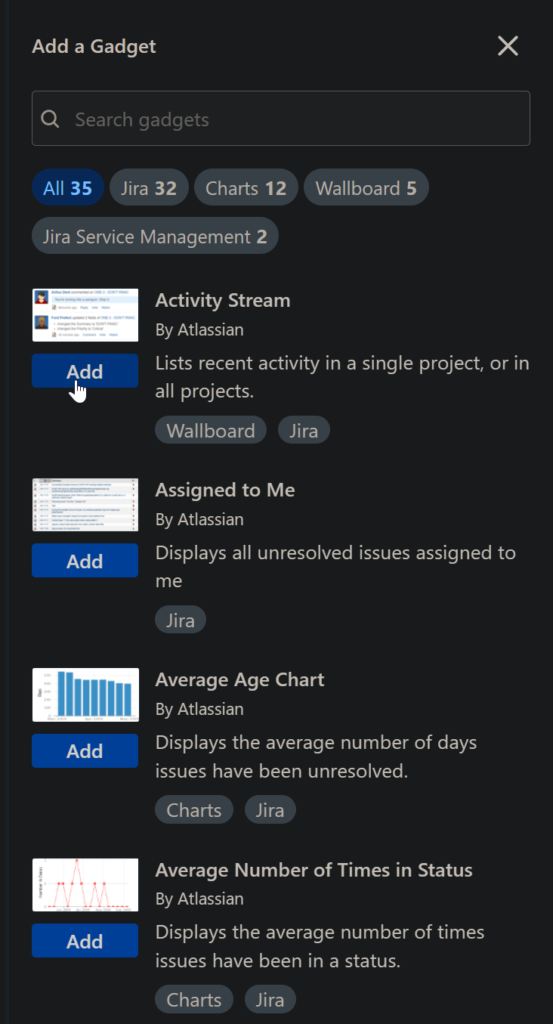
Depending on the gadget, you may need to configure the settings of said gadget. In the case for the Average Time in Status: Facilities gadget, we had to input what project, what status and how frequent to refresh data.